Technical illustration of the i3D® technology

i3D® Technology

i3D® Imprint Test according to DIN SPEC 4864.

Local yield strength, tensile strength and stress-strain data directly on the part: i3D® combines Indentation Plastometry, optical 3D acquisition and inverse FEM in one traceable workflow.

Test workflow

Step by step from an indentation to a local material statement.

The process logic moves in four steps from the local surface to the plastic stress-strain curve: indentation, 3D measurement, inverse FEM and the derived material properties.

Step 1

Create the indentation

A force-controlled indenter moves orthogonally into the metallic surface. That creates the local and minimally invasive starting point for the later property evaluation.

local force-controlled minimally invasive

Step 2

Optical 3D measurement

White light interferometry captures the indentation with high vertical and lateral resolution. That records not just depth, but the real geometry of the tested zone.

WLI 3D topography precise capture
Inverse FEM evaluation

Step 3

Inverse FEM evaluation

An optimisation algorithm compares the real indentation shape with FEM simulations. From that, the local material response is reconstructed model-based and translated into an evaluable stress-strain relationship.

inverse FEM model correlation stress-strain curve

Step 4

Material properties and curves

The calculated stress-strain curve provides the local yield strength, tensile strength and other mechanical properties. That turns the indentation into a directly usable data set for development, QA and material assessment.

Rᶦₚ₀.₂ Rᶦₘ engineering data

Technology value

What i3D® actually delivers

The technology matters when local material properties are not just measured, but used as a robust basis for engineering decisions.

Local yield strength

Rᶦₚ₀.₂ can be determined locally wherever the real zone is more relevant mechanically than the global average of an idealised specimen.

Local tensile strength

Rᶦₘ becomes accessible on part zones, small specimens, welds and critical areas, without first extracting a classical tensile specimen from the same zone.

Stress-strain relationships

Together with the inverse evaluation, the indentation can be used to derive plastic stress-strain relationships that are suitable for material assessment and model building.

An evaluable workflow

The indentation, optical 3D capture and inverse FEM together form a traceable technological workflow instead of just a single isolated number.

Method classification

What is comparable to tensile testing and where interpretation is needed

In short: Rᶦₚ₀.₂ and Rᶦₘ are closely comparable. Elongation at break and hardening need tighter interpretation.

Property Comparable Interpretation
Rᶦₚ₀.₂ yield strength Comparable Yes Interpretation closely comparable
Tensile strength Rᶦₘ Comparable Yes Interpretation closely comparable
Elongation at break A Comparable Partly Interpretation qualitative or limited
Hardening behaviour Comparable Partly Interpretation qualitatively comparable

Data depth

Properties, stress-strain curves and a clear evaluation path.

The i3D® evaluation does not stop at the indentation image. The indentation geometry, optical measurement and inverse evaluation are used to determine local stress-strain relationships. From these, yield strength Rᶦₚ₀.₂, tensile strength Rᶦₘ and the course of plastic hardening can be derived for the tested zone.

240 MPa Local yield strength Rᶦₚ₀.₂ shown
575 MPa Local tensile strength Rᶦₘ shown
0,223 Ductility derived from i3D

Scientifically, the relevance does not come from the stress-strain curve shape alone, but from the derivation of robust local properties from small or critical material zones.

That is exactly where the method addresses questions around Rᶦₚ₀.₂, Rᶦₘ and local stress-strain curves, while classical tensile testing is often too large, too expensive or geometrically unsuitable.

Engineering and true stress-strain curve Comparison of the engineering stress-strain curve and the derived true stress-strain curve. 0 180 360 540 720 0 0.063 0.125 0.188 0.25 Plastic strain ε_pl (-) Stress σ (MPa)
This curve section shows the relationship between the engineering curve and the derived true stress-strain curve. From this evaluation path, local stress-strain curves, yield strength Rᶦₚ₀.₂, tensile strength Rᶦₘ and the hardening behaviour of the tested zone are derived.

Simplified workflow according to DIN SPEC 4864

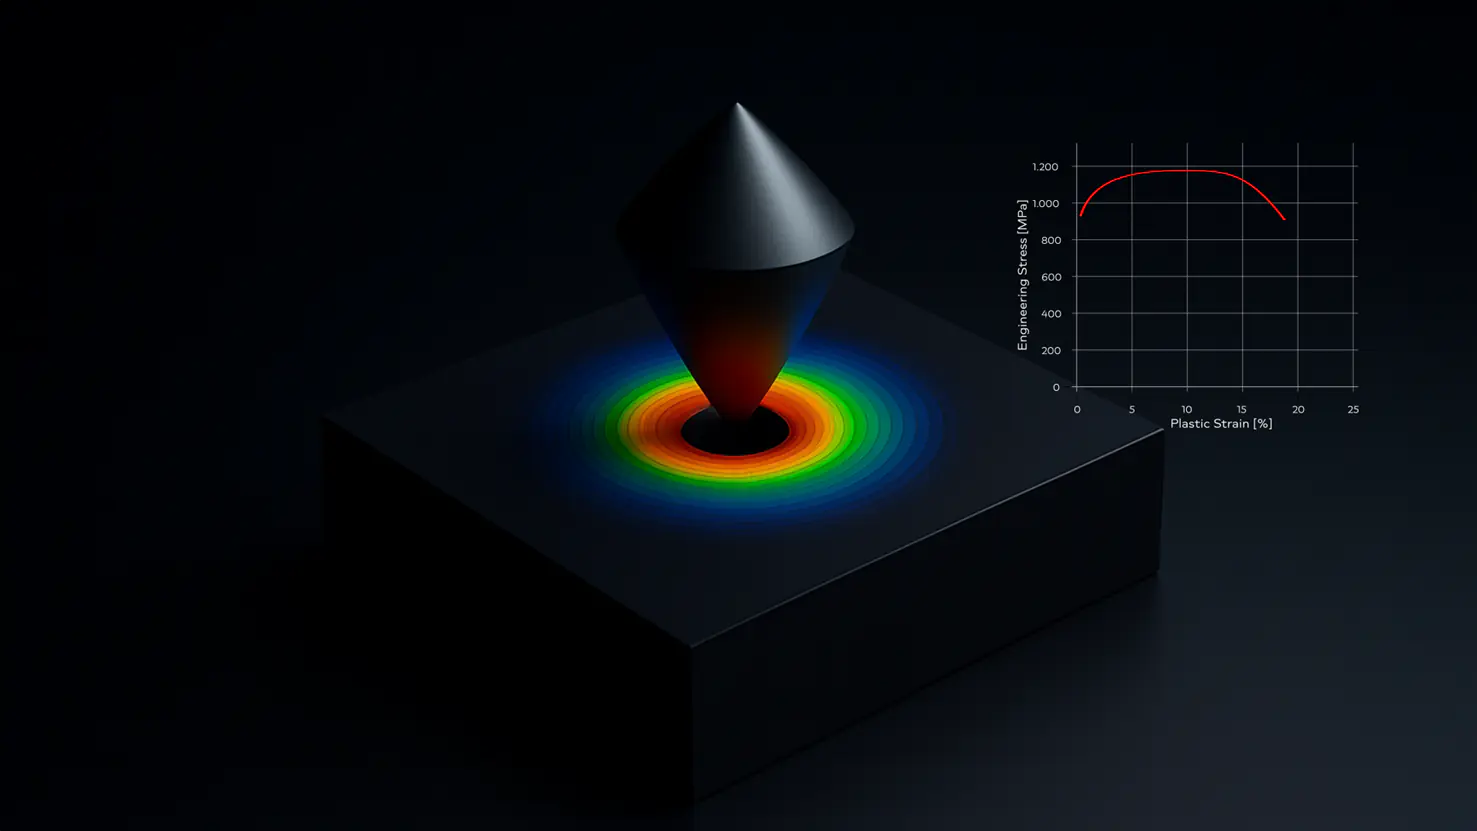
i3D® combines the indentation, optical 3D capture and model-based evaluation in one continuous workflow according to DIN SPEC 4864. The value does not lie in one isolated feature, but in the controlled coupling of these steps.

That turns the local indentation into an evaluable data basis for Rᶦₚ₀.₂, Rᶦₘ and further mechanical relationships, without having to reproduce the full classical specimen route in every case.

  • create the indentation on the relevant zone
  • capture the topography and indentation geometry of the zone
  • translate the result model-based into robust properties

What defines a good measurement run in practice

A good run starts before the evaluation. What matters is a clean task definition, the right zone and reproducible boundary conditions.

If measurement location, material state and target property match, the indentation becomes a technically usable decision basis rather than an isolated number.

  • align the measurement location and the material question carefully
  • ensure repeatable testing and capture conditions
  • always interpret the result in the application context

What must still be interpreted method-specifically

i3D® does not replace every other method in every context. Its strength lies where local material insight, part proximity and time savings are especially important.

That is why the technology page also needs a clean classification: what is meaningfully comparable to tensile testing and classical material characterisation, where the limits are and when an additional validation step makes sense.

  • a local result is not automatically identical to a global average
  • material state, zone and task determine the right interpretation
  • additional tests can still make sense depending on the objective

Positioning

The decision sits on local relevance, part proximity and the limits around elongation at break and hardening. That is what determines whether i3D® fits technically.

Contacts

Direct contacts for technology, laboratory work and project clarification.

Useful when zone, target properties, comparison path or feasibility need to be clarified directly with a technical contact.

Dr.-Ing. Benjamin Schmaling

Dr.-Ing. Benjamin Schmaling

Founder and CEO

Contact for the technology itself, the method classification and strategic i3D® use concepts.

LinkedIn
Peter Zok

Peter Zok

Applications and materials testing

Contact for materials testing, application questions and the technical classification of real measurement tasks.

LinkedIn

Which measurement task would you like to clarify technically?

Describe the material, the zone, the part or the target property as precisely as possible. That allows Imprintec to assess how i3D® can be used in your case.

Your contact details

Whether you need a technical demo, a lab start or a method discussion, your details help us route the request correctly.

Official form

Privacy settings

Website data usage.

Essential technologies are required. With your consent, we measure usage and channel performance. No personalized advertising is used on this website.

Statistics: website performance. Marketing: campaign measurement. Consent can be changed at any time. Privacy policy

Selection

Choose in detail which categories may be used.